
From Data Chaos to Connected Intelligence: How Microsoft Fabric Supercharges Power BI for Manufacturing
Modern manufacturers generate more data than ever - from IoT sensors on machines to ERP and MES systems tracking production and cost. But the real challenge isn’t collecting data - it’s connecting it. Disconnected systems, slow refreshes, and inconsistent insights often delay critical decisions on the factory floor.
While Power BI has long been the primary tool for visualization, its effectiveness can be hampered by fragmented, inconsistent data sources, leading to delayed or unreliable insights.
That’s where Microsoft Fabric comes in - providing a unified data foundation that transforms Power BI from a visualization tool into a real-time manufacturing intelligence platform.
Data & License Challenges: Why Power BI Needs Fabric
Manufacturers typically deal with data scattered across multiple systems, creating bottlenecks for analysts trying to compute unified metrics
Before Fabric, manufacturers faced three major obstacles to scalable analytics in Power BI:
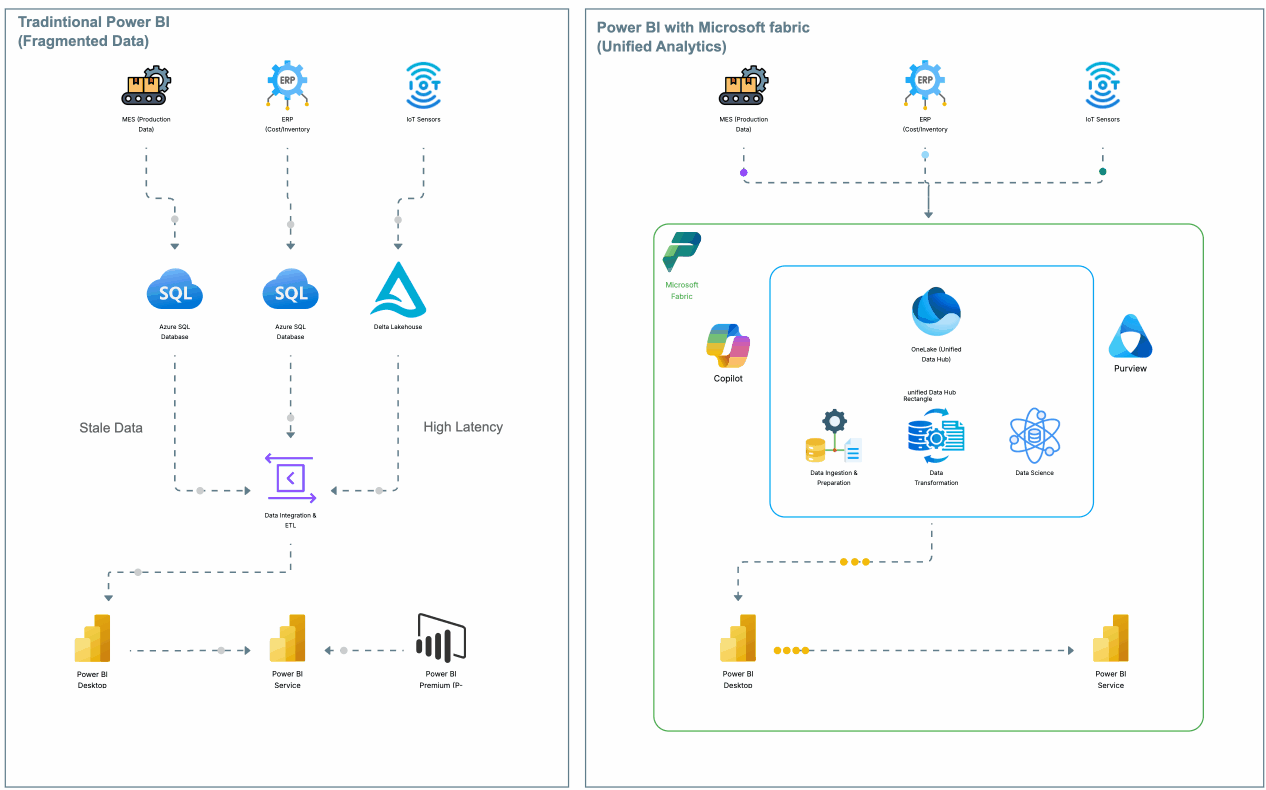
- Data Silos: Production data (MES), machine health (IoT), and inventory/cost data (ERP) reside in separate, often incompatible, systems.
- Inconsistent Data Quality: The complexity of integrating these disparate sources manually leads to data discrepancies and inconsistencies
- Real-Time Limitations: High-velocity IoT data overwhelmed traditional storage and refresh cycles.
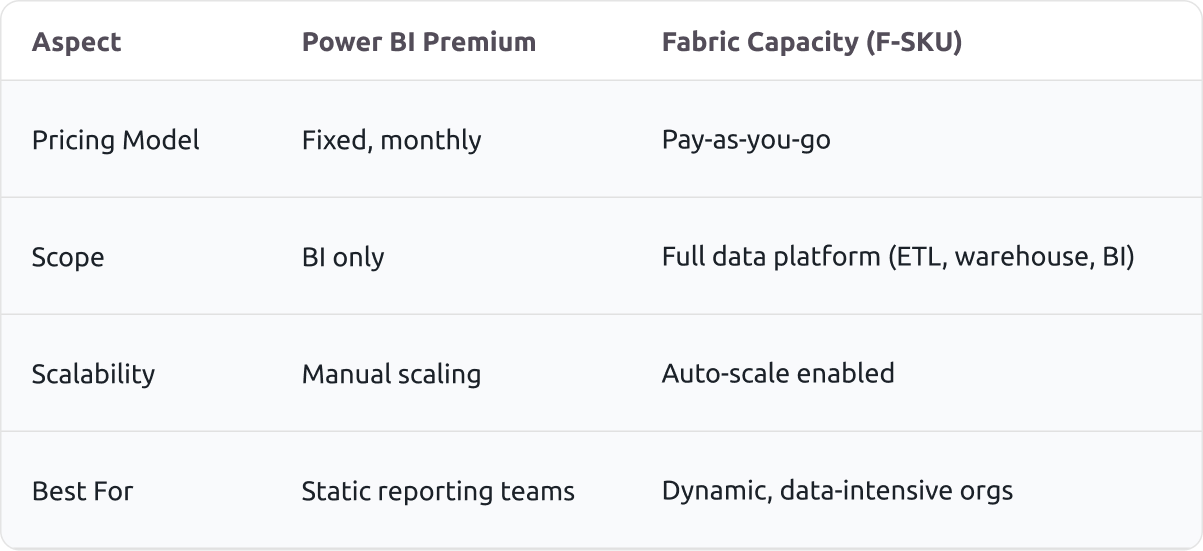
- Licensing Rigidity: The static, high cost of Power BI Premium (P-SKUs), which lacked flexibility and locked users into a BI-only toolset.
Microsoft Fabric: The Unified Data Engine
Fabric integrates all data workloads- data engineering, data warehousing, and BI-into a single Software as a Service (SaaS) platform.
OneLake: The Heart of Fabric
Fabric’s OneLake acts as a single, governed data foundation for your entire organization - think of it as OneDrive for your data.
- Single Source of Truth: Instead of connecting Power BI to multiple data sources (SQL, Data Lake, etc.), Fabric allows you to connect it to OneLake. This automatically ensures all reports pull from governed and consistent data, providing a single, reliable view of operations, inventory, and quality.
- Decoupled Storage and Compute: OneLake utilizes the open-source Delta Lake format, which natively supports ACID transactions. This guarantees the reliability and integrity of your high-volume sensor readings and production logs.
Real-Time and Scalable Analytics
For manufacturers dealing with thousands of data points per second, Fabric provides the performance and scale necessary for immediate action:
- Native Real-Time Processing: Fabric is designed to ingest and process high-velocity, high-volume streaming data from IoT devices and machinery efficiently.
- Simplified Data Engineering: The integrated Data Factory capabilities within Fabric simplify the process of transforming and preparing raw manufacturing data, making data modelling in Power BI significantly easier and faster.
The Fabric Capacity (F-SKU) Benefit
Fabric licenses offer Pay-as-you-go pricing. This allows manufacturers to scale capacity up during intensive, dynamic, large-scale data engineering jobs (like processing a month's worth of sensor data) and scale it down when compute usage is low. This optimizes IT spend and aligns costs directly with fluctuating business needs.
Before & After: The Modern Manufacturing Data Architecture
See how Microsoft Fabric transforms fragmented Power BI setups into a unified, governed, and scalable data ecosystem
Benefits: Power BI Reimagined
Case Study: A 200%+ ROI in Year 1
A specialty components manufacturer was losing $40K/month due to unplanned machine downtime. Data existed, but across disconnected systems. Analysis took days, causing reactive interventions.
The Problem in Focus
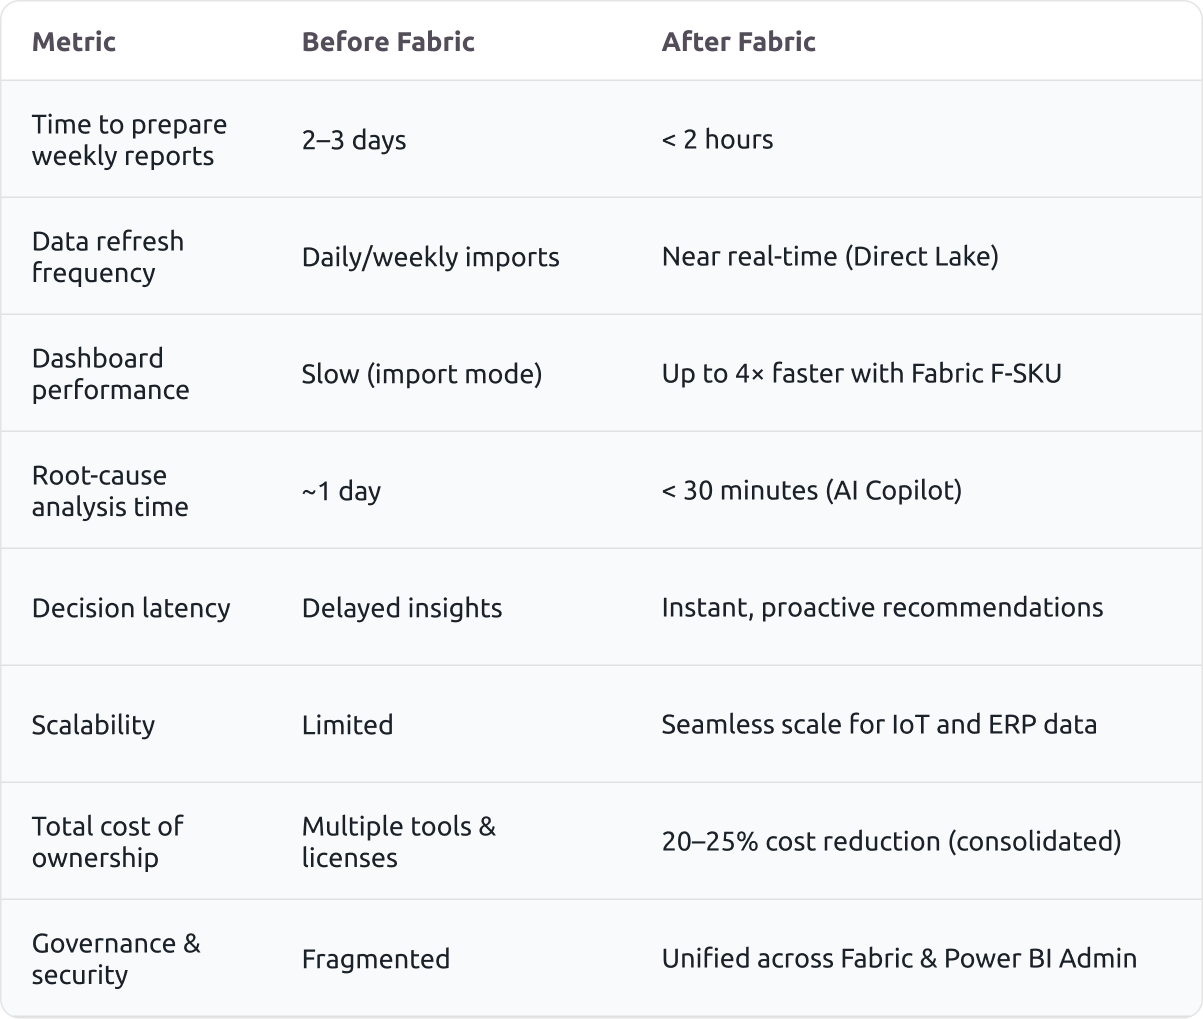
The production line suffered from chronic unplanned downtime, costing them approximately $40 K per month. The root cause was data fragmentation: sensor error codes, machine logs, and maintenance records were scattered across different, isolated systems. Engineers spent 2–3 days manually trying to connect these dots, meaning all analysis was reactive.
The Fabric + Copilot Solution
The production line suffered from chronic unplanned downtime, costing them approximately $40 K per month. The root cause was data fragmentation: sensor error codes, machine logs, and maintenance records were
We migrated our client's operational data pipeline to Microsoft Fabric, targeting real-time analysis:
Unified Data Core: All operational data was centralized into OneLake.
Zero-Latency BI: Power BI leveraged Direct Lake Mode to deliver immediate, real-time views of machine performance and error codes, eliminating data refresh latency.
Accelerated Analysis: Engineers used Copilot in Power BI to instantly generate visuals for root-cause analysis, collapsing a multi-day investigation into minutes.
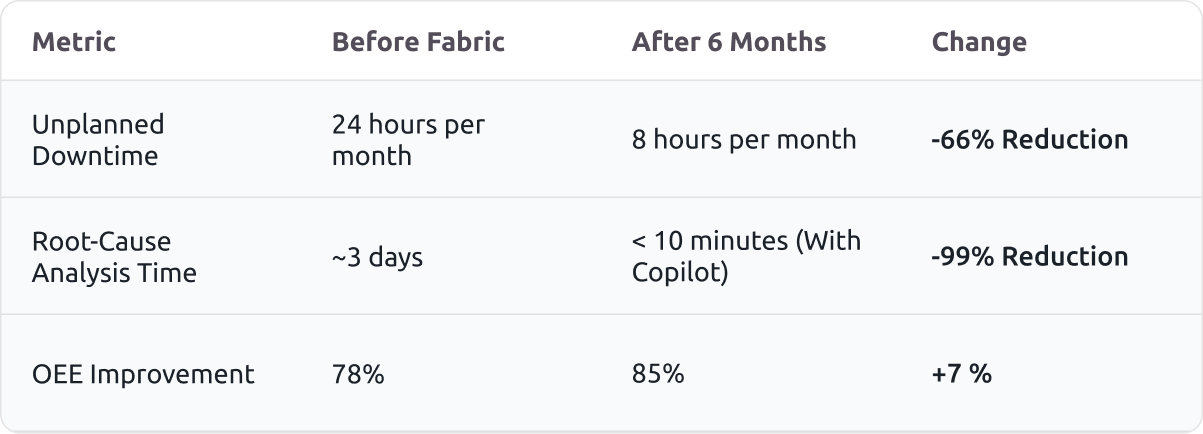
The Quantifiable ROI
The result was a transformation from reactive failure management to proactive maintenance, delivering immediate financial returns:
Financial Result:
200%+ ROI in first year through reduced downtime and productivity gains.
Conclusion
Fabric isn’t just an IT upgrade; it’s a performance multiplier.
Key Takeaways
Power BI + Microsoft Fabric delivers:
- Real-time visibility into operations
- Proactive maintenance and fewer stoppages
- Scalable, cost-efficient analytics on one platform
Ready to Modernize Your Manufacturing Analytics?
Let’s help you unlock real-time intelligence with Microsoft Fabric.
.webp)
